SonarQube - Deployment, Integration and Configuration

Web architect cum developer working in the .NET ecosystem with Azure and having completed many successful projects and products mainly Syncfusion Data Platform - Bold BI and Bold Reports.
Skilled in Full stack web development involving ASP.Net Core MVC, Web API, SQL, jQuery, Scss, Webhooks, Azure, DevOps, TDD, and Agile development.
Implemented a robust and flexible permission management system for an enterprise server application which is the base for Syncfusion's Data Platform - boldbi.com and Syncfusion Report Platform - boldreports.com
Deployment
SonarQube is a web service that can run in our Azure App Service. It uses an SQL database to store code analysis reports.
We can use the SonarQube docker available in Docker Hub to deploy the app into Azure App Service.
Here is the docker-compose.yml,
version: "3"

services:
  sonarqube:
    image: sonarqube:lts-enterprise
    environment:
      SONARQUBE_JDBC_URL: jdbc:sqlserver://testsql.database.windows.net:1433;database=sonarqube-enterprise-edition;user=sonarqube@sql-server-sonarqube;password=Admin@123;encrypt=true;trustServerCertificate=false;hostNameInCertificate=*.database.windows.net;loginTimeout=30;
      SONARQUBE_JDBC_USERNAME: sonarqube
      SONARQUBE_JDBC_PASSWORD: Admin@123
      WEBSITES_PORT: 80
    volumes:
      - sonarqube_data:/opt/sonarqube/data
      - sonarqube_extensions:/opt/sonarqube/extensions
      - sonarqube_logs:/opt/sonarqube/logs
      - sonarqube_temp:/opt/sonarqube/temp
    ulimits:
      nproc: 131072
      nofile:
        soft: 8192
        hard: 131072
    ports:
      - "80:9000"
volumes:
  sonarqube_data:
  sonarqube_extensions:
  sonarqube_logs:
  sonarqube_temp:
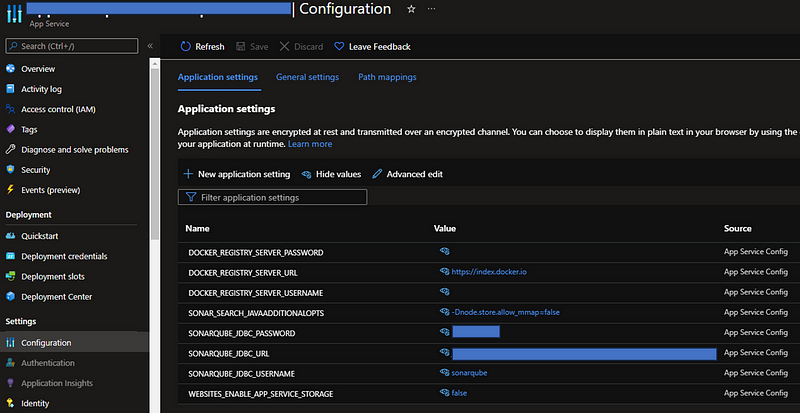
The credential for the database is added in the docker-compose.yml file. This is needed when the app is started.
We can also configure the same from the Configuration.
Prerequisites
You can check SonarQube’s requirements here — https://docs.sonarqube.org/latest/requirements/requirements/
App Service
For the app to run in Azure App Service, we need a P2V2 plan. This is because the app internally has an Elastic Search service, and it needs more memory. Otherwise, you will see the app running and getting stopped after some time.
You can always use the Log Stream in the App Service to watch the logs from the app.
Database
MS SQL Database must have case-sensitive and accent-sensitive collation.
SQL_Latin1_General_CP1_CS_AS
When you start the application for the first time, it will ask you to reset the default password. Default credentials will be — username: admin, password: admin.
Integration
You have the below integration steps to do the SonarQube analysis,
Adding your DevOps repo in SonarQube
Updating your DevOps pipelines with SonarQube Analysis and Reporting tasks
Here is the SonarQube documentation for the same,
https://docs.sonarqube.org/latest/analysis/azuredevops-integration
Below you will see the simplified steps of the same documentation,
Prerequisites
1. Personal Access Token must be generated with Read and Write Access for the Code module. This is needed in the SonarQube project addition module.
2. Install the SonarQube extension in Azure DevOps — https://marketplace.visualstudio.com/items?itemName=SonarSource.sonarqube
3. Access to your DevOps repo settings for adding the SonarQube service connection to it.
Adding your DevOps repo in SonarQube
Repo addition
Start by clicking on the “Add Project” button and selecting DevOps. This will be a self-explanatory form.
Feed in the PAT you obtained for your account in DevOps with Read and Write Access for the Code module.
Using the PAT, SonarQube will list the Projects in DevOps. Find your DevOps project and choose the repo.
This will create the project in SonarQube.
Updating your DevOps pipelines with SonarQube Analysis and Reporting tasks
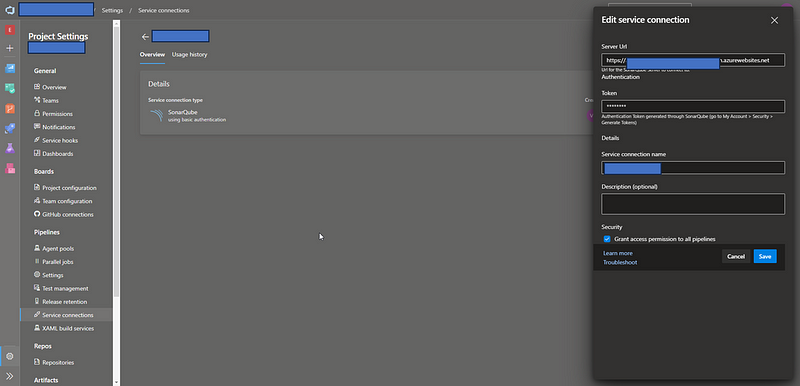
Once you add the project, you can configure the analysis in your DevOps pipeline. Add the SonarQube server URL as a service connection in your project settings.
Configure Analysis
In your DevOps pipeline, do the following,
Add the SonarQube Preparation task before your Build task
Add the SonarQube Analysis task after your Build task
Add the SonarQube Publish task after the analysis task
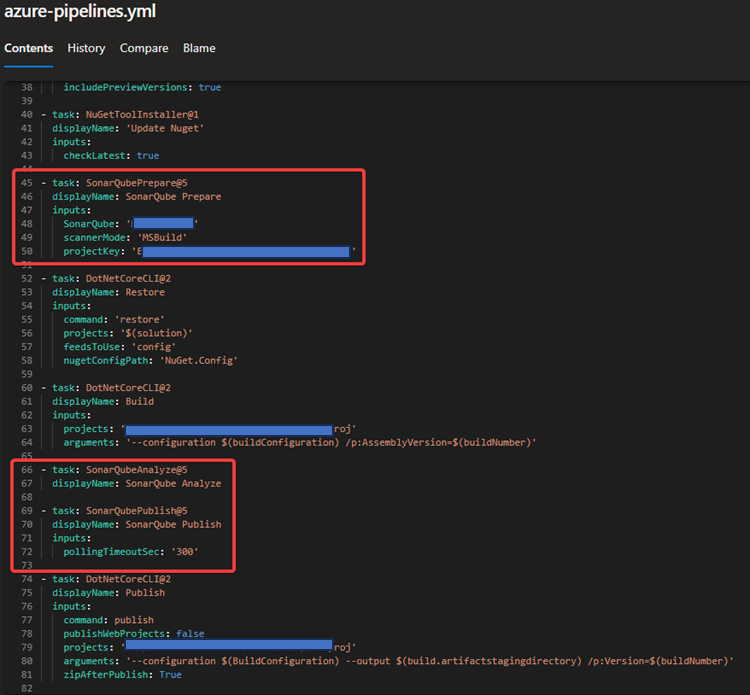
SonarQube preparation task must be fed with the service connection we created in the previous step.
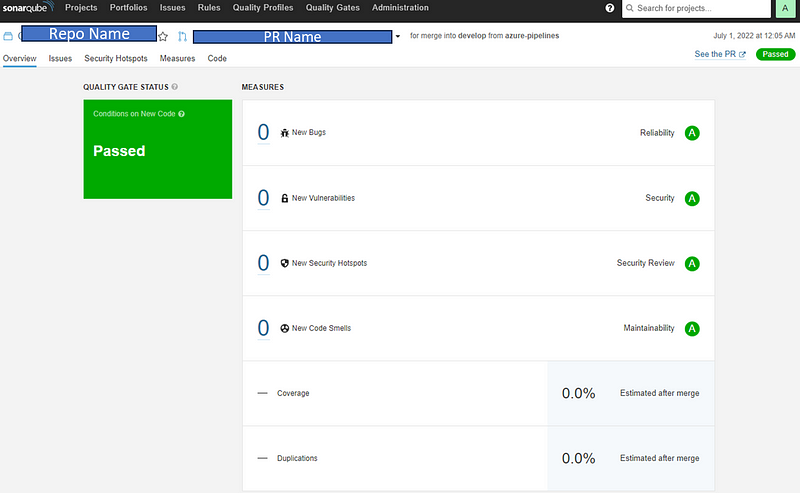
Now, if you run your pipeline, you should see the analysis report in the SonarQube project below,
Configuration of SonarQube rules
SonarQube has an inbuilt ruleset that is categorized in different facets, and it is synchronized with new SonarQube release versions too.
You will find detailed documentation here — https://docs.sonarqube.org/latest/user-guide/rules
Here we will see the simplified version of the same,
SonarQube has around 400+ rules spanning several types => bugs, vulnerability, code smell, and security hotspots for C#.
Hierarchically, rules come below Quality Profiles. Rules can be grouped under a Quality profile and these profiles can be assigned to the projects as needed.
SonarQube comes with a default quality profile for each language and cannot be edited. But it can be extended with new rules.
New Quality profiles can be created based on the existing ones. Under the new quality profiles, rules can be activated/deactivated based on the needs.
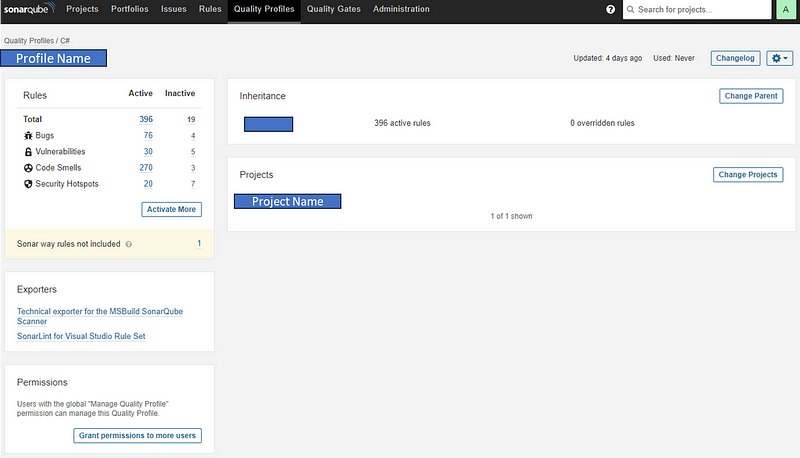
Activating/Deactivating a Rule in a Quality Profile
Steps,
Open the Quality Profile.
On the left side, you will the rule types with their active and inactive counts.
You can click on any of the counts to filter and see the rules that are active/inactive.
Once you are on the Rules page, make sure you are editing the correct Quality profile by seeing that on the left side.
You can also make bulk changes based on your needs.
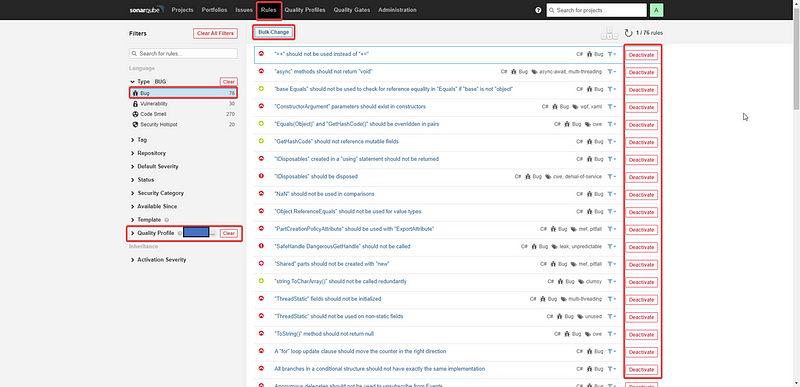
Once the activation or deactivation of the rules is done, it will immediately reflect in your existing reports as well. So, everything is dynamic.
Even for your older analysis reports, you can activate new rules.
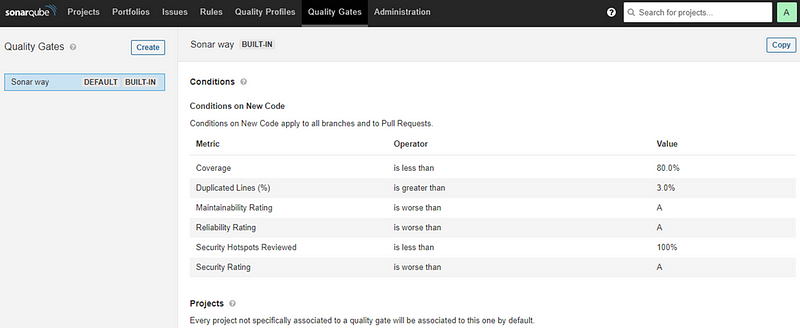
Quality Gates
This is an optional module that can be set up in your Azure DevOps branch policy to ensure that your repo is complying with all the rules you set up. This gate can be used to prevent the PR (Pull Request) from being merged.
As a process, you do not have to set this up initially and you will have to mandate this once you fix all the rules.
https://docs.sonarsource.com/sonarqube/latest/user-guide/quality-gates/
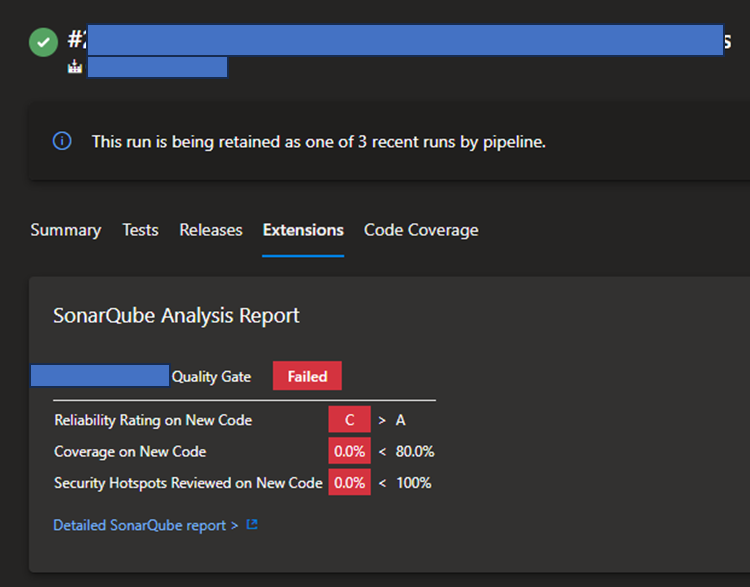
SonarQube Report summary in DevOps
You will always have a report summary in your pipeline, under extensions and you can open the SonarQube site report from here.
SonarLint Extension in VS
We can install the SonarLint extension in VS and get the analysis while doing the development itself.
Here is the link for SonarLint Extension,
https://marketplace.visualstudio.com/items?itemName=SonarSource.SonarLintforVisualStudio2022
As SonarQube supports different quality profiles for different projects, the project that you run in VS also needs the same Quality profile so that we can coordinate with the rule sets configured in the project. To do this, we can connect the SonarLint in VS to our SonarQube server.
Connect SonarLint to SonarQube Server
Here is the documentation on how to do this,
https://github.com/SonarSource/sonarlint-visualstudio/wiki/Connected-Mode
Here we will see the simplified version of the same,
Install SonarLint extension.
Go to Team Explorer in VS and select SonarQube.
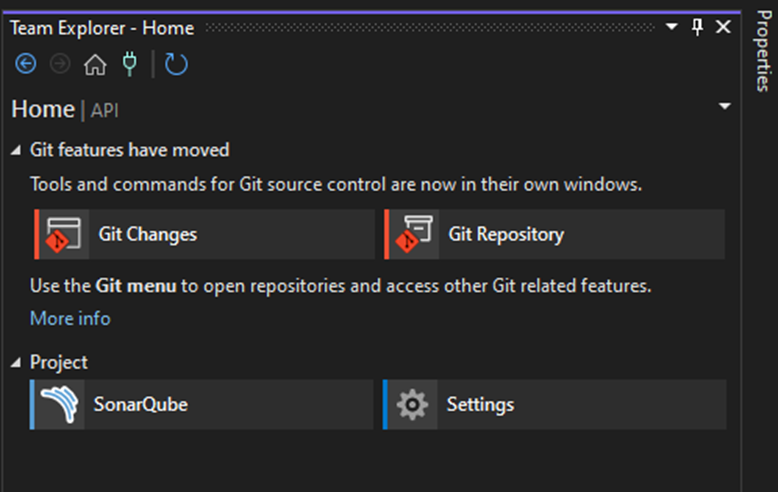
3. Feed the credentials.
4. Select the appropriate project and that is all.